
Reference Data center home / All paths / Measuring and assessing data center noise
Measuring and assessing data center noise
Measuring noise from data centers can be challenging. Most noise regulations are built around a single metric — the A-weighted decibel (dBA), regardless of the other characteristics of the noise. Those dBA metrics can work reasonably well for some sources, but not for environmental noise sources that have strong low frequency and tonal components, like data centers, military jets, bass music, construction, generators, and ventilation systems. These components in data center noise account for the low, persistent hum, whooshing, or throb, which some people say they can feel more than hear. This sound — originating from the data center’s cooling systems, power systems, or electrical transformers — is exactly the kind of sound that ordinary A-weighted measurement discounts or underweights. Reliance on dBA metrics in regulations may allow data centers to be technically compliant with the regulatory provision, while enabling harm to surrounding communities. That’s because the specific type of noise residents are experiencing was not evaluated. This isn’t a case of anyone hiding anything. It’s a case of the standard tool not asking the right question. The good news is that appropriate tools exist and are described in established national and international standards.

Data center noise measurement methods
This page describes some of those standards and what they actually require.
What residents can check themselves
The fortunate thing today is that you don’t need professional equipment to get a first, useful read on whether what you’re hearing has a low-frequency component. A free smartphone app usable by most anyone can provide an indication of low frequency noise.
The quick screen. Many free sound-meter apps are able to measure sound levels using not only the “A-weighted” decibel (dBA) (the standard) but also the “C-weighted” (dBC) or “unweighted” decibel (e.g., zero-weighted; dBZ). The dBC and dBZ both account for the contribution of low frequency components to the total sound level. If the values of the dBA and dBC (or dBZ) are close together, it is less likely that the sound being measured has strong low frequency components (see “One important gap” below). If the dBC is roughly 10 decibels or higher than the dBA — that gap is a strong signal that low-frequency sound components are present. This 10-decibel gap is included in the 2005 edition of the ANSI S12.9 standard. The current 2021 edition of that ANSI standard no longer uses a gap to screen for low frequency noise; rather, it recommends measuring the low-frequency content of the sound directly. The 10-decibel gap is therefore best treated as a simple, rule-of-thumb indicator that suggests when it is recommended that the characteristics of the sound be investigated further.
What this does and doesn’t prove. A smartphone measurement can tell you whether there is a meaningful difference between dBC and dBA levels, but these measurements are generally not calibrated and shouldn’t be treated as an official decibel measurement. It’s enough to know whether the problem may be real and is worth pursuing, and enough to give an official or attorney a concrete starting point explaining why you clearly hear the noise indoors and why it is disturbing. On their own, these smartphone measurements do not substitute for measurements using certified sound level equipment; they are a first step. The next step is a professional analysis.
One important gap. Smartphone microphones can vary by brand and model of phone. In general, they are not great at detecting very low frequency sound. That’s why a small gap between the dBA and dBC (or dBZ) doesn’t necessarily prove that low-frequency sound is absent. In short, a small gap reading could be a false negative and needs to be confirmed by higher quality equipment, but a large gap of roughly 10 decibels or greater is definitely a basis for further investigation.
When and where to check. Nighttime noise can be most disturbing and have the most deleterious effects on health. This is because nighttime is generally much quieter while the levels of the continuous noise from data centers remains the same and may even be higher, meaning that the contrast in sound levels is heightened from late night to early morning. Check indoors as well as outdoors — with windows closed. That may seem backward, but as the standards below confirm, low-frequency sound isn’t meaningfully blocked by ordinary walls and windows, so an indoor bedroom reading is at least as relevant as one taken outside, and it’s the one most local noise rules never ask anyone to take.
If what you find suggests a meaningful gap between the dBA and dBC measurements, the next step is to request sound measurement from a licensed professional — which is where the rest of this document picks up.
How professionals can measure and describe this noise
There’s no single standard for “data center noise.” What exists instead is a set of standards, each built to characterize certain aspects of the noise.
How can one measure outdoors, at a residence, in the first place?
ASA/ANSI S12.18 sets out general and precision methods for taking an outdoor sound measurement properly, including how wind and temperature affect a reading. ASTM E1780 covers the specific case of sound coming from a fixed source like a power plant or pump — a close match for a data center’s cooling and electrical equipment.
How can one measure the low-frequency part specifically and identify the source of tonal sounds like hum and throb, not just the overall loudness?
This is the standard that matters most: ASA/ANSI S12.9, Part 7. It lays out how to measure low-frequency noise both outdoors in windy conditions and indoors, in an occupied room, where the sound behaves differently than it does outside. Narrow band frequency analysis is what readily shows the presence of tones.
How does one determine, with certainty, whether a tone is really present?
ANSI/ASA S1.13 provides a precise method (in its Annex A) for measuring how far a tone stands out above the surrounding background. ANSI/ASA S12.9-2021/Part 4 adds 5 dB to the assessed level when a prominent tone is audible at the receiver, and narrowband analysis of this kind is how such a tone is shown to be present.
How can one evaluate what’s happening indoors — not just whether it’s audible, but whether it’s a real problem?
ASA/ANSI S12.2 provides criteria built specifically for low-frequency, fluctuating indoor noise, including thresholds for the kind of building vibration or rattle that residents sometimes describe. Of equal importance, it is critical to listen to what residents are perceiving, how it is affecting their lives, and connecting the dots between that and the characteristics of the noise.
What does the 2021 ANSI standard (Part 4) add for low-frequency and tonal sound?
ANSI/ASA S12.9-2021/Part 4 is the standard for judging long-term community response to noise. Its 2021 edition no longer asks whether the dBC exceeds the dBA level by 10 decibels before a low-frequency assessment applies. Instead, it describes strong low-frequency content as perceptible infrasound and/or sound capable of causing vibration or rattles, singles out the 16, 31.5 and 63 Hz bands as especially important, and notes that dBA metrics can underpredict annoyance levels from such sound. It also adds adjustments to its annoyance assessment for a tone that is prominent and audible (5 dB), for a quiet rural setting (10 dB), and for a new, unfamiliar source (5 dB). The standard supplies concepts for assessment, not limits for data centers, and it gives no prediction method for short-term, infrequent sources such as generator testing.
How can one predict what a facility will sound like before it’s even built?
This is where standard dBA metrics have serious shortcomings. The standard method, ISO 9613-2, calculates predicted noise levels across a range of frequencies — but that range only goes down to 63 Hz. In the United States, the same method is also published as ANSI/ASA S12.62-2012 (R2020), an adoption of ISO 9613-2 with national modifications. The 16 Hz and 31.5 Hz bands that matter for the low-frequency problem described above simply aren’t part of the calculation. A-weighted metrics discount low frequency content, which is what has been the main source of disturbance for communities around existing large data centers. It is important to examine the full frequency spectrum and determine the sound level in each frequency band. It is also critical to understand that an A-weighted metric is not a sufficient or useful basis for predicting noise levels at a distance, e.g., at residents’ homes. The rate of attenuation of low frequency sound is much lower compared with that of higher frequency sound. It travels much further and penetrates walls and windows. Modeling the sound level at a distant home based on ISO 9613-2 results in overstating the loss of sound energy over distance and understating what actually reaches a home. While this may be appropriate for some kinds of sources, it is totally inadequate for data center noise. Of course, considerations of the size and layout of the facility, wind direction and temperature conditions, like nighttime inversions, need to also be considered to estimate the noise reaching the residence or other receptor site.
Making a prediction that considers low-frequency and tonal sound seriously, ahead of a data center build-out, requires five things: that it be built from the equipment’s measured sound levels in each frequency band, taken from test reports rather than sales literature; that it give the predicted level at each nearby home, band by band, using one-third octave band and narrow band analyses; that the predicted C-weighted level be reported alongside the A-weighted level; that the baseline used for comparison be measured in the same frequency bands, since a baseline taken only in A-weighted terms cannot show changes once the facility is established; and that it be validated against the results from a comparable facility and setting.
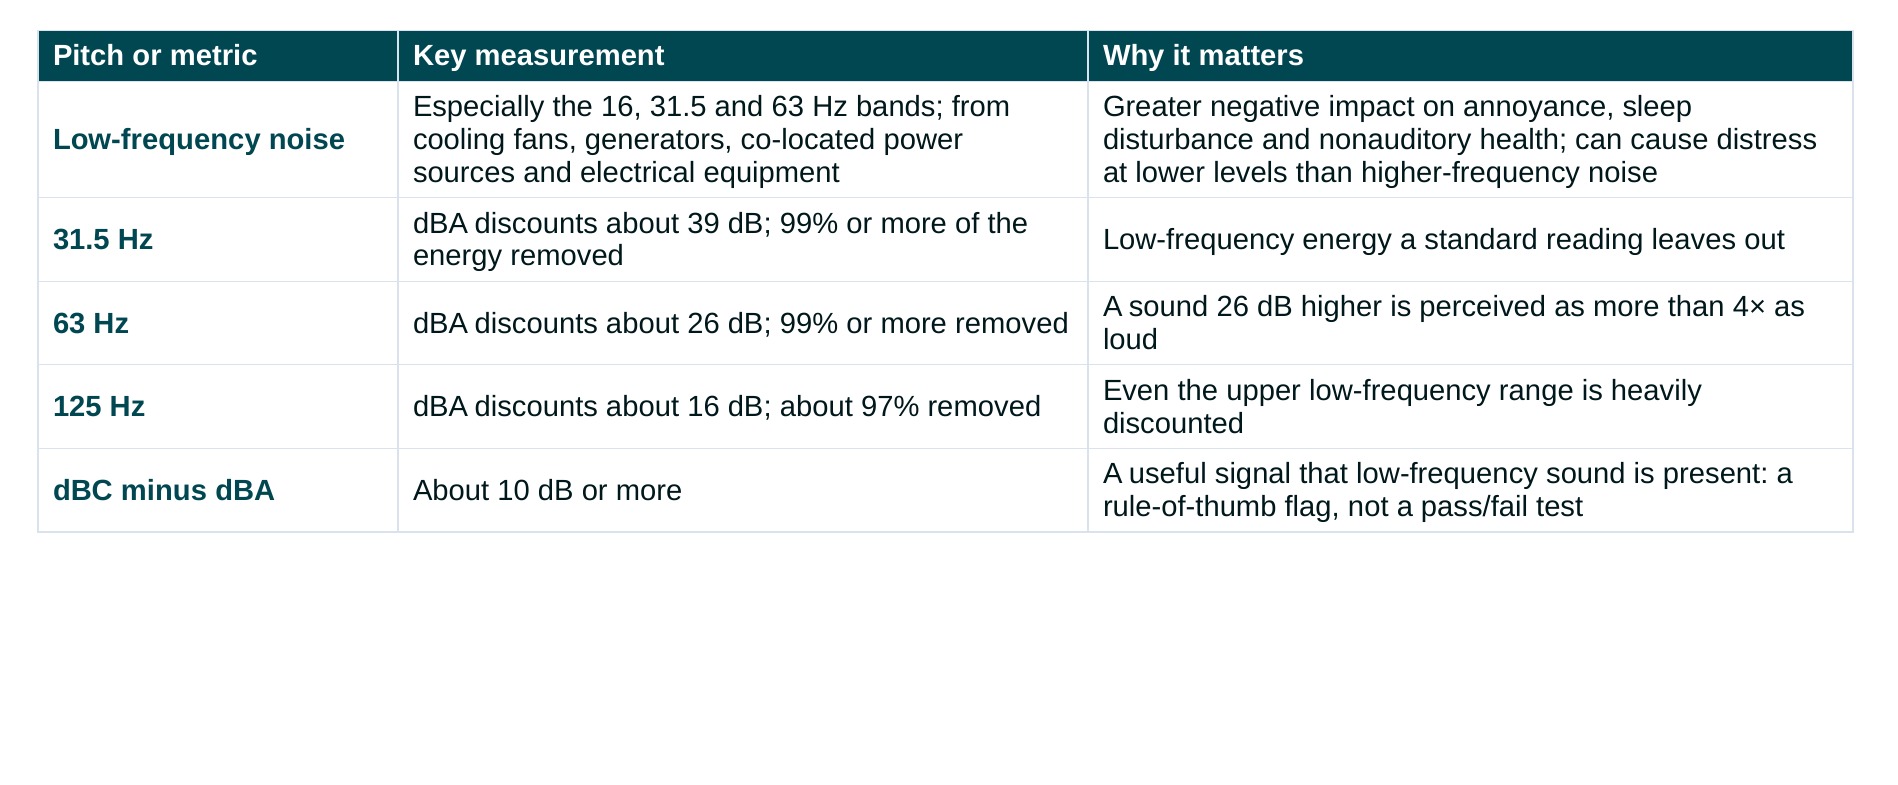
Pitch and measurement: what standard readings leave out
| Pitch or metric | Key measurement | Why it matters |
|---|---|---|
| Low-frequency noise | Especially the 16, 31.5 and 63 Hz bands; from cooling fans, generators, co-located power sources and electrical equipment | Greater negative impact on annoyance, sleep disturbance and nonauditory health; can cause distress at lower levels than higher-frequency noise |
| 31.5 Hz | dBA discounts about 39 dB; 99% or more of the energy removed | Low-frequency energy a standard reading leaves out |
| 63 Hz | dBA discounts about 26 dB; 99% or more removed | A sound 26 dB higher is perceived as more than 4× as loud |
| 125 Hz | dBA discounts about 16 dB; about 97% removed | Even the upper low-frequency range is heavily discounted |
| dBC minus dBA | About 10 dB or more | A useful signal that low-frequency sound is present: a rule-of-thumb flag, not a pass/fail test |
Precedent already in place
New York’s current renewable-energy facility noise rule — 16 NYCRR 1101-2.7 and 1101-3.5(a), effective March 2026 — already applies the tools previously described: for wind and solar facilities, a 5 dBA penalty when a tone is present and a presumption of tonality where manufacturers haven’t supplied the needed data, with transformers presumed to produce a prominent tone with no exception; and for wind facilities, an unweighted low-frequency limit measured at 16, 31.5, and 63 Hz. A jurisdiction adopting comparable requirements for data centers isn’t inventing a new regulatory approach — it’s applying tools the state already uses for another new class of energy facility. For wind facilities, the rule also requires ongoing compliance testing after construction — the same kind of requirement Henry County, Virginia adopted independently for its data center ordinance.
How much louder than the existing background?
A single decibel limit, (e.g., 50 dBA) takes no account of how quiet the surroundings are. For example, where the nighttime background is around 30 dBA, facility sound of 40 dBA is clearly noticeable to residents, yet it would sit well under a generic limit of 50 dBA. Looking at how much a facility raises the existing background is one way to examine this. A change of about 3 dB is roughly where most listeners begin to notice a difference in level, which is why a rise of about that size is sometimes used as a point of reference, as in planning practices in the UK. We mention it for context, not as a recommended limit. Any such comparison depends heavily on where the measurements are taken. A commonly used approach is to measure at the nearest noise-sensitive locations, meaning homes, schools, hospitals and similar places, rather than at the facility boundary, and at several of them rather than one, often five to seven, with each location shown on a map and the reason for choosing it explained. Background levels should be measured at those same locations, away from nearby sources such as busy roads that raise the background and make a new facility look less intrusive. The comparison is most meaningful at night, when the background is lowest, with the facility operating at its worst-case condition. Schools and hospitals may justify a lower target than homes. ANSI/ASA S12.9-2021/Part 4 recognizes the same principle in its own way: it adds 10 dB to its annoyance assessment in a quiet rural setting (which, absent better information, it indicates by background levels of about 45 dBA by day and 35 dBA at night).
Where the reference levels sit
Different settings, averaging periods, and kinds of evidence. These figures are not interchangeable limits or a universal safe-noise scale.
30 dBA
Indoors at night
WHO’s 1999 community-noise guidance uses 30 dBA for bedrooms at night and says lower values are needed when low-frequency sound is prominent.
35 dBA
Classrooms
WHO’s 1999 community-noise guideline for classroom background noise during teaching.
40 dB
Outdoors at night
WHO’s 2009 night-noise target: an annual average outside bedrooms, expressed as Lnight,outside. This is a different metric from a short sound-level reading.
45 dB
Indoor residential reference
EPA’s 1974 indoor day-night average reference for protecting against activity interference and annoyance.
50 dBA
Road-traffic research
The QC guide cites an 8% higher relative risk of ischemic heart disease per 10 dB increase starting here. This is an association from road-traffic studies, not a data-center exposure limit.
55 dB
Outdoor residential reference
EPA’s 1974 outdoor day-night average reference. WHO’s 1999 guidance also gives 55 dBA for outdoor living areas in daytime and evening, using a different averaging period.
A separate screening check: A dBC–dBA difference can flag low-frequency sound for closer investigation. A rule of thumb is not a pass/fail test; examine the sound in individual frequency bands.
Sources: WHO community noise (1999); WHO night noise (2009); EPA levels document (1974); van Kempen et al. (2018), as cited in the health guide.
What the standards say about A-weighting, in their own words
ANSI’s own text recognizes the limits of A-weighting for some of the sounds emitted by data centers, and which echoes criticism by the National Academy of Engineering (NAE 2010), the World Health Organization (WHO 1999), and others of the inadequacy of the dBA in measuring sound that contains prominent low frequency content. The 2021 edition of ANSI/ASA S12.9/Part 4 notes that A-weighting can underpredict annoyance from sound with strong low-frequency content. The 2021 edition also emphasizes that strong low-frequency problems are often most consequential indoors, because walls and windows block less of the sound at low frequencies and room resonances can amplify particular frequency bands. In plain terms, closing the doors and windows doesn’t solve this, and measuring only at the property line can miss the reasons that the noise is adversely impacting the lives and health of those in the surrounding community. The 2021 edition also treats vibration and rattle as a distinct concern, the sensation residents often describe simply as “vibration.” It gives indoor reference values for the 16, 31.5 and 63 Hz bands: 65, 65 and 70 dB (Z-weighted, meaning unweighted) for vibration or rattle that is moderately perceptible and 75, 75 and 80 dB for vibration or rattle that is clearly perceptible, which an indoor investigation can compare with measured levels.
An immediate fix that accomplishes a great deal
One request accomplishes more than any other, in almost every situation — an existing facility, a facility under review, or a not-yet-written ordinance: require that the average dBC level (LCeq) be measured and reported alongside the standard average dBA (LAeq) level. Any Class 1 or Class 2 sound level meter computes both simultaneously. It matters because without the two levels, the simplest check for low-frequency content cannot be made: a C-minus-A gap of about 10 dB or more is a useful flag, although not a pass/fail test, and a smaller gap does not prove that low-frequency sound is absent. The 2005 edition of ANSI S12.9 Part 4 required that gap before its low-frequency assessment applied; the 2021 edition no longer does. In addition, if a dBA penalty is automatically applied in the absence of the detection of tones with narrow-band analysis, that would trigger an effective hum evaluation process. The penalty is best understood as a starting point: 5 dB(A) matches New York’s rule for renewable-energy facilities and the 5 dB tonal adjustment in ANSI/ASA S12.9-2021/Part 4. The penalty is simple to apply, but there is no guarantee it will adequately resolve the impact of the tonal noise that is present. In short, it should accompany the measurements described above rather than replace them.
References
American National Standards Institute / Acoustical Society of America. ANSI/ASA S1.13-2020 (R2025). Measurement of Sound Pressure Levels in Air.
American National Standards Institute / Acoustical Society of America. ASA/ANSI S12.2-2019 (R2023). Criteria for Evaluating Room Noise.
American National Standards Institute / Acoustical Society of America. ASA/ANSI S12.9-2021/Part 4. Quantities and Procedures for Description and Measurement of Environmental Sound — Part 4: Noise Assessment and Prediction of Long-term Community Response.
American National Standards Institute / Acoustical Society of America. ANSI S12.9-2005/Part 4. Quantities and Procedures for Description and Measurement of Environmental Sound — Part 4: Noise Assessment and Prediction of Long-term Community Response. (Earlier edition, cited for the 10 dB C-minus-A applicability criterion that the 2021 edition removed.)
American National Standards Institute / Acoustical Society of America. ASA/ANSI S12.9-2016/Part 7 (R2025). Measurement of Low-frequency Noise and Infrasound Outdoors in the Presence of Wind and Indoors in Occupied Spaces.
American National Standards Institute / Acoustical Society of America. ASA/ANSI S12.18-1994 (R2023). Procedures for Outdoor Measurement of Sound Pressure Level.
American National Standards Institute / Acoustical Society of America. ANSI/ASA S12.62-2012 (R2020). Attenuation of Sound During Propagation Outdoors, Part 2 (modified national adoption of ISO 9613-2).
ASTM International. ASTM E1780-12(2021). Standard Guide for Measuring Outdoor Sound Received from a Nearby Fixed Source.
International Electrotechnical Commission. IEC 61672-1. Electroacoustics — Sound Level Meters — Part 1: Specifications.
International Organization for Standardization. ISO 9613-2:2024. Acoustics — Attenuation of Sound During Propagation Outdoors — Part 2: General Method of Calculation.
New York State Department of Public Service / Office of Renewable Energy Siting. 16 NYCRR Part 1101, §§1101-2.7, 1101-3.5(a) (effective March 9, 2026).
World Health Organization. Berglund, B., & Lindvall, T. (Eds.). (1995). Community Noise. Archives of the Center for Sensory Research, 2(1), 1–195.

This website is designed to be shared
Download, print, or send this page to a neighbor, a doctor, or a local official.